DSQL sucks at TPC-B
Recently Kate Gowron from DoiT published Comparing Aurora DSQL vs. Aurora Serverless v2: A Practical Cost Analysis on Medium.
I don’t know Kate personally, but I was quite excited when this article came out. When we announced the Preview of Aurora DSQL at re:Invent last year, Kate and team made a fantastic video on the DoiT YouTube channel:
direct link: Amazon Aurora Distributed SQL (DSQL): How it works & when Aurora DSQL makes sense
Kate is clearly an expert. Her presentation is on point, and it was a pleasure listening to her.
Chapter 1: In which Marc gets sad
When a colleague shared her recent Medium article, I immediately gave it a read. I knew what Kate thought about DSQL in theory, but now that DSQL has been out for three weeks, what does she actually think in practice?
Reading Kate’s article made me sad. This comment in particular made me groan:
So it’s not cheaper and it appears to be considerably slower, so…
If you haven’t read her article, here’s an AI sentiment summary. I think it’s pretty spot on:
Based on the article, the overall sentiment is notably skeptical and somewhat negative towards Aurora DSQL when compared to Aurora Serverless v2. The author, Kate Gawron, presents a detailed cost and performance analysis that reveals DSQL to be both more expensive (by approximately 13%) and significantly slower (4 times slower) than Aurora Serverless v2 in their benchmark testing. The article suggests that DSQL’s value proposition is limited to very specific use cases, such as situations requiring low-latency multi-region writes or when dealing with massive scale operations where traditional Aurora RDS is becoming a bottleneck.
The conclusion is rather lukewarm towards DSQL, essentially suggesting that unless you have very specific needs that align with DSQL’s strengths, Aurora Serverless v2 remains the more practical choice for most users.
Given such bad results, why is Kate lukewarm towards DSQL? When I was reading this article I got more and more sad, and was fully expecting a brutal conclusion. Instead, Kate says:
I’m not going to dwell too long on the performance side. [..] because DSQL performs so differently from any other database you might consider using, a like-for-like performance test is tough to do.
Remember, Kate is an expert. She understands this benchmark well, and she understands the DSQL architecture and tradeoffs well.
In this article, I’m going to unpack exactly what Kate did, why it performs poorly, and hopefully help you (dear reader) more deeply understand when, where and how to use DSQL.
Chapter 2: The setup
In Kate’s article, she runs the following command:
pgbench -n -p 60 -h "$DB_HOST" -p "$DB_PORT" -U "$DB_USER" -d "$DB_NAME" -c 1 -j 2 -t "$NUMBER_OF_TRANSACTIONS"

transaction type: <builtin: TPC-B (sort of)>
scaling factor: 1
query mode: simple
number of clients: 1
number of threads: 1
number of transactions per client: 100000
number of transactions actually processed: 100000/100000
latency average = 19.700 ms
initial connection time = 243.453 ms
tps = 50.760523 (without initial connection time)
pgbench is a benchmarking tool that is shipped with Postgres. On macOS, a
brew install postgresql will give you a server, CLI (psql), pgbench and a
whole lot more.
pgbench runs scripts, some of which are built into the tool. The default
script is TPC-B (sort of), which looks like this:
{
    "tpcb-like",
    "<builtin: TPC-B (sort of)>",
    "\\set aid random(1, " CppAsString2(naccounts) " * :scale)\n"
    "\\set bid random(1, " CppAsString2(nbranches) " * :scale)\n"
    "\\set tid random(1, " CppAsString2(ntellers) " * :scale)\n"
    "\\set delta random(-5000, 5000)\n"
    "BEGIN;\n"
    "UPDATE pgbench_accounts SET abalance = abalance + :delta WHERE aid = :aid;\n"
    "SELECT abalance FROM pgbench_accounts WHERE aid = :aid;\n"
    "UPDATE pgbench_tellers SET tbalance = tbalance + :delta WHERE tid = :tid;\n"
    "UPDATE pgbench_branches SET bbalance = bbalance + :delta WHERE bid = :bid;\n"
    "INSERT INTO pgbench_history (tid, bid, aid, delta, mtime) VALUES (:tid, :bid, :aid, :delta, CURRENT_TIMESTAMP);\n"
    "END;\n"
},
You don’t need to study that script right now, we’ll unpack the details as we go. For now, let’s try replicate Kate’s results.
$ aws dsql create-cluster --no-deletion-protection
{
    "identifier": "4aabugk53f6nrpbfogoziglici",
    "arn": "arn:aws:dsql:us-west-2:332656840177:cluster/4aabugk53f6nrpbfogoziglici",
    "status": "CREATING",
    "creationTime": "2025-07-02T11:16:05.736000-07:00",
    "deletionProtectionEnabled": false
}

aws dsql wait cluster-active --identifier 4aabugk53f6nrpbfogoziglici
Now that I have a new cluster, let’s run pgbench --initialize to setup the
cluster with the right schema and records. If you’re not familiar with
pgbench, this is what initialization does:
Initialization options:
  -i, --initialize         invokes initialization mode
  -I, --init-steps=[dtgGvpf]+ (default "dtgvp")
                           run selected initialization steps, in the specified order
                           d: drop any existing pgbench tables
                           t: create the tables used by the standard pgbench scenario
                           g: generate data, client-side
                           G: generate data, server-side
                           v: invoke VACUUM on the standard tables
                           p: create primary key indexes on the standard tables
                           f: create foreign keys between the standard tables
The init-steps are going to be important. For now, let’s setup our environment:
export AWS_REGION=us-west-2
export PGHOST=4aabugk53f6nrpbfogoziglici.dsql.us-west-2.on.aws
export PGUSER=admin
export PGPASSWORD=$(aws dsql generate-db-connect-admin-auth-token --hostname $PGHOST --expires-in 86400)
export PGSSLMODE=require
export PGDATABASE=postgres
This setup will give us the right environment variables for pgbench to connect
for 24 hours.
$ pgbench -i

dropping old tables...
NOTICE:  table "pgbench_accounts" does not exist, skipping
NOTICE:  table "pgbench_branches" does not exist, skipping
NOTICE:  table "pgbench_history" does not exist, skipping
NOTICE:  table "pgbench_tellers" does not exist, skipping
creating tables...
pgbench: error: query failed: ERROR:  WITH clause not supported for CREATE TABLE
pgbench: detail: Query was: create table pgbench_tellers(tid int not null,bid int,tbalance int,filler char(84)) with (fillfactor=100)
Oh dear. with (fillfactor=100) is not supported. What is fillfactor? CREATE
TABLE says:
The fillfactor for a table is a percentage between 10 and 100. 100 (complete packing) is the default. When a smaller fillfactor is specified, INSERT operations pack table pages only to the indicated percentage; the remaining space on each page is reserved for updating rows on that page. This gives UPDATE a chance to place the updated copy of a row on the same page as the original, which is more efficient than placing it on a different page, and makes heap-only tuple updates more likely. For a table whose entries are never updated, complete packing is the best choice, but in heavily updated tables smaller fillfactors are appropriate. This parameter cannot be set for TOAST tables.
DSQL doesn’t use Postgres’ storage engine. We have our own engine, optimized for
our needs. This option doesn’t make sense in our engine, and so we don’t
“support” it. pgbench doesn’t have a way to disable this option; it’s part of
the schema for this workload. We’re going to have to create these tables
by hand.
Before we do that, notice that the DDL to create the table doesn’t declare
primary keys. If you were paying attention to init-steps earlier, you’d see
that by default ("dtgvp") the script will add a primary key after creating the
table:
p: create primary key indexes on the standard tables
When we make the tables by hand, we’re going to add the primary keys as part of
the create table. In DSQL, primary keys must be declared when the table is
defined (see Primary keys in Aurora DSQL). If you don’t define one, DSQL will
assign a synthetic hidden ID.
create table pgbench_history(tid int,bid int,aid int,delta int,mtime timestamp,filler char(22));
create table pgbench_tellers(tid int primary key,bid int,tbalance int,filler char(84));
create table pgbench_accounts(aid int primary key,bid int,abalance int,filler char(84));
create table pgbench_branches(bid int primary key,bbalance int,filler char(88));
If you’re keeping score, this means that "dtgvp" is now "gv". What about the
other two? Well, v id for VACUUM. As with fillfactor, vacuuming is not
necessary on DSQL. We have our own storage engine, and take care of garbage
collecting old row versions as part of the service. Which means we’re just left
with generating data for our tables:
pgbench -i --init-steps g
generating data (client-side)...
pgbench: error: query failed: ERROR:  unsupported statement: Truncate
pgbench: detail: Query was: truncate table pgbench_accounts, pgbench_branches, pgbench_history, pgbench_tellers
What about the other option, G: generate data, server-side?
pgbench -i --init-steps G
generating data (server-side)...
pgbench: error: query failed: ERROR:  unsupported statement: Truncate
pgbench: detail: Query was: truncate table pgbench_accounts, pgbench_branches, pgbench_history, pgbench_tellers
Unfortunately, there is no easy way to disable calling truncate in pgbench,
it’s hardcoded:
static void
initGenerateDataServerSide(PGconn *con)
{
    PQExpBufferData sql;

    fprintf(stderr, "generating data (server-side)...\n");

    /*
     * we do all of this in one transaction to enable the backend's
     * data-loading optimizations
     */
    executeStatement(con, "begin");

    /* truncate away any old data */
    initTruncateTables(con);
This means there is no way to use pgbench to generate the data. If you read
the code, you’ll see that the server-side generator uses generate_series. By
default, this workload creates the following number of rows per table:
- branches: 1
- tellers: 10
- accounts: 100000
Which means that even if we got past truncate, we’d have failed when this
query ran:
printfPQExpBuffer(&sql,
                  "insert into pgbench_accounts(aid,bid,abalance,filler) "
                  "select aid, (aid - 1) / %d + 1, 0, '' "
                  "from generate_series(1, " INT64_FORMAT ") as aid",
                  naccounts, (int64) naccounts * scale);
I’m not sure how Kate got past this point. My guess is she ran the server-side
generation by hand. When she got to the accounts table, she’d have had to run
generate_series 4 times (3x 3000, 1x 1000).
Oh no! Kate, I’m so sorry you had to muddle through all this. We didn’t make it easy for you, did we?
Chapter 3: Adding DSQL support to pgbench
How much time do you think we made Kate spend getting pgbench --initialize to
work? She’s an expert, so probably not very long. Maybe 30 minutes to an hour?
Kate’s not the first person to try pgbench out. There’s a lot of interest in
DSQL. Customers are curious. Let’s make it easier.
If you want to cut to the chase for this section, here’s the TL;DR:
marcbowes/postgres on GitHub has been updated to support pgbench --dsql.
I have a fork of Postgres on my GitHub: https://github.com/marcbowes/postgres.
This fork adds builtin support for DSQL token generation into libpq so that
you don’t need to generate tokens on the command line (as I showed earlier).
There’s an install link in the README, after which you should be able to use
pdsql:
pdsql --host=your-dsql-endpoint.example.com --user=admin --port=5432 --dbname=postgres
Let’s give pgbench the same treatment, but also take care of the
initialization incompatibilities. Here are all the changes I had to make:
- Added the
--dsqlflag. - Updated the
CREATE TABLEDDLs to specify their primary keys. [breaking]- For
pgbench_history, I explicitly added a primary key:id uuid primary key default gen_random_uuid()
- For
- Updated the
CREATE TABLEto not usefillfactorwhen in DSQL mode. - Skipped
truncatewhen in DSQL mode. - Skipped table partitioning when in DSQL mode.
- Updated client-side generation to work when in DSQL mode (which uses
COPY):- Disable freeze, which is neither supported nor required (
copy .. with (freeze on)). - Load in batches of 1000 instead of a single large transaction.
- Disable freeze, which is neither supported nor required (
These changes were all simple to make. Only number 2 is a breaking change. With a bit more effort, I could make that change not affect vanilla (not DSQL) mode. I also didn’t bother fixing server-side generation yet.
Ok, let’s try it:
$ pgbench --dsql --host $PGHOST --user admin --dbname postgres -i
dropping old tables...
NOTICE:  table "pgbench_accounts" does not exist, skipping
NOTICE:  table "pgbench_branches" does not exist, skipping
NOTICE:  table "pgbench_history" does not exist, skipping
NOTICE:  table "pgbench_tellers" does not exist, skipping
creating tables...
generating data (client-side)...
done in 4.06 s (drop tables 0.02 s, create tables 0.60 s, client-side generate 3.44 s, primary keys 0.00 s).

$ pdsql --host $PGHOST --user admin --dbname postgres
pdsql (18beta1, server 16.9)
SSL connection (protocol: TLSv1.3, cipher: TLS_AES_128_GCM_SHA256, compression: off, ALPN: postgresql)
Type "help" for help.

postgres=> select count(*) from pgbench_history;
 count
-------
     0
(1 row)

postgres=> select count(*) from pgbench_tellers;
 count
-------
    10
(1 row)

postgres=> select * from pgbench_tellers limit 3;
 tid | bid | tbalance | filler
-----+-----+----------+--------
   1 |   1 |        0 |
   2 |   1 |        0 |
   3 |   1 |        0 |

postgres=> select count(*) from pgbench_accounts;
 count
--------
 100000
(1 row)

postgres=> select * from pgbench_accounts limit 3;
 aid | bid | abalance |                                        filler
-----+-----+----------+--------------------------------------------------------------------------------------
   1 |   1 |        0 |
   2 |   1 |        0 |
   3 |   1 |        0 |

postgres=> select count(*) from pgbench_branches;
 count
-------
     1
(1 row)

postgres=> select * from pgbench_branches limit 3;
 bid | bbalance | filler
-----+----------+--------
   1 |        0 |
Ok, now we’re up and running!
If you’re wondering about the filler column:
/*
 * Note: TPC-B requires at least 100 bytes per row, and the "filler"
 * fields in these table declarations were intended to comply with that.
 * The pgbench_accounts table complies with that because the "filler"
 * column is set to blank-padded empty string. But for all other tables
 * the columns default to NULL and so don't actually take any space.  We
 * could fix that by giving them non-null default values.  However, that
 * would completely break comparability of pgbench results with prior
 * versions. Since pgbench has never pretended to be fully TPC-B compliant
 * anyway, we stick with the historical behavior.
 */
Chapter 4: Replicating results
To recap, here’s what Kate ran:
pgbench -n -p 60 -h "$DB_HOST" -p "$DB_PORT" -U "$DB_USER" -d "$DB_NAME" -c 1 -j 2 -t "$NUMBER_OF_TRANSACTIONS"
From the output of her report, $NUMBER_OF_TRANSACTIONS appears to be 100000.
Let’s look at the CLI help again:
Benchmarking options:
  -c, --client=NUM         number of concurrent database clients (default: 1)
  -j, --jobs=NUM           number of threads (default: 1)
  -t, --transactions=NUM   number of transactions each client runs (default: 10)
-c 1 -j 2 therefore means “one client, two threads” which doesn’t make a lot
of sense. Earlier in Kate’s article she says:
I had to run with a single client, as due to the optimistic locking [..] lots of the clients errored on DSQL due to conflicts so the test wasn’t fair across both engines
My guess is she had higher values for --client and --jobs at one point,
then lowered clients but not threads. pgbench actually deals with this case,
so it’s not a problem:
if (nthreads > nclients)
    nthreads = nclients;
From Kate’s report, she got a little under 20ms per transaction. At ~50tps, this means the test will take 2,000 seconds, or a little over 30 minutes to complete:
pgbench --dsql --host=4aabugk53f6nrpbfogoziglici.dsql.us-west-2.on.aws --user=admin --dbname=postgres -c 1 -t 100000
Chapter 5: What’s TPC-B (sort-of) anyways?
While that runs, let’s dig into that script in more detail. Each transaction is going to randomly pick a row from each of the three base tables:
    "\\set aid random(1, " CppAsString2(naccounts) " * :scale)\n"
    "\\set bid random(1, " CppAsString2(nbranches) " * :scale)\n"
    "\\set tid random(1, " CppAsString2(ntellers) " * :scale)\n"
Remember, we have 100000 accounts, 10 tellers, and only 1 branch. So, every transaction is going to pick the same branch.
Next, we’re going to generate a random “delta” in some range. The range is completely irrelevant to performance:
"\\set delta random(-5000, 5000)\n"
We then update each of the three base tables. First, we update the account’s balance by the delta, then read back the balance:
-- accounts
UPDATE pgbench_accounts SET abalance = abalance + :delta WHERE aid = :aid;
SELECT abalance FROM pgbench_accounts WHERE aid = :aid;
Then, we do the same thing for the chosen teller:
-- tellers
UPDATE pgbench_tellers SET tbalance = tbalance + :delta WHERE tid = :tid;
And for the chosen branch. Remember, there’s only one of these:
-- branches
UPDATE pgbench_branches SET bbalance = bbalance + :delta WHERE bid = :bid;
The final step is to insert an audit record into the history table:
INSERT INTO pgbench_history (tid, bid, aid, delta, mtime)
     VALUES (:tid, :bid, :aid, :delta, CURRENT_TIMESTAMP);
Let’s do some napkin math for this transaction. From the Circle of Life, we know we have an architecture that looks like this:
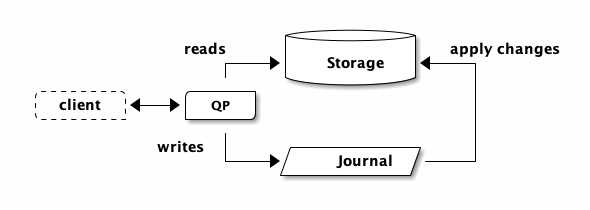
Each transaction will need to read from storage. An UPDATE statement needs to
query storage to see how many rows you are updating, and what the update should
be. So, we have three UPDATE statements, and therefore three reads from
storage.
pgbench is going to run these statements one at a time (this script doesn’t
use pipelining). We need to pick some latency numbers.
postgres=> \timing
Timing is on.
postgres=> select 1;
 ?column?
----------
        1
(1 row)

Time: 1.980 ms
My client is about 2ms away from DSQL (check your own setup).
Let’s pretend we have about 500μs between QP and storage.
This means we have:
| Statement | Client-DSQL | QP-Storage | Cumulative |
|---|---|---|---|
| UPDATE accounts | 2 | 0.5 | 2.50 |
| SELECT accounts | 2 | 0.5 | 5.00 |
| UPDATE tellers | 2 | 0.5 | 7.50 |
| UPDATE branches | 2 | 0.5 | 10.00 |
But we’re not done with reads. We also need to read from pgbench_history.
Primary keys must be unique, and so DSQL must check to ensure there is no
existing row. This seems kind of silly (we’re using default
gen_random_uuid()), but users could specify the primary key and cause a
duplicate. Duplicates are bad.
| Statement | Client-DSQL | QP-Storage | Cumulative |
|---|---|---|---|
| INSERT history | 2 | 0.5 | 12.50 |
And finally, we commit. Let’s use ~5ms for that. That brings us to about 17ms total.
If Kate was seeing 20ms, then we can infer the following:
- Kate was testing from within the same AWS region as her DSQL cluster. Otherwise, she’d be getting significantly worse transaction latency.
- The fact we’re seeing more than 17ms is a clue that the system is not operating as efficiently as possible (due to the design of this workload).
So, now you know what “TPC-B (sort-of)” is. But what is TPC-B, and how is pgbench’s version different? TPC-B is a deprecated benchmark. You can find the spec here (pdf).
TPC-B measures throughput in terms of how many transactions per second a system can perform. (Obsolete as of 6/6/95)
In August 1990, the TPC approved its second benchmark, TPC-B. In contrast to TPC-A, TPC-B is not an OLTP benchmark. Rather, TPC-B can be looked at as a database stress test, characterized by [..]
The implementation in pgbench doesn’t attempt to be a faithful TPC-B
implementation. The differences don’t really matter for our purposes.
It is worth emphasizing that TPC-B isn’t designed to be an OLTP benchmark. DSQL is designed to be a scalable, highly available OLTP system. That’s not what this benchmark is for. This benchmark is designed to stress databases.
So… does this benchmark stress DSQL? Not at all. The same “design” that is used to stress traditional systems also results in a workload that doesn’t scale horizontally on DSQL. DSQL isn’t stressed by this workload. The way this workload was designed is inherently anti-scale, and so things just run slowly.
Chapter 6: Results are in!
latency average = 17.242 ms
tps = 57.998366 (without initial connection time)
Looks like my run was slightly better than Kate’s — and closer to the napkin math. I’m guessing Kate was running in a different AWS region to me.
Being on the service team, I get to look under the hood. The dataset size is
around 30MiB. The entire benchmark ran on a single QP. This is to be expected,
since we set --client=1. It took 2379s (around 40 minutes).
DSQL hasn’t attempted to scale this workload out at all. DSQL scales writes and reads independently, and neither were under meaningful load. Storage was seeing more traffic, but never went above ~12% CPU utilization. In fact, because there was only traffic from a single client in a single AZ, only the replica in that AZ was utilized at all. The additional replicas in other AZs were simply applying updates. They were ready to be used, but there was no need. There’s really no point scaling this workload out.
Usually with benchmarking, you want to run for a decent chunk of time so that the system can warm up. If you want to try out this test for yourself, I wouldn’t bother running for as long as Kate did - it’s never going to get faster.
Chapter 7: Let’s make everything worse
Let’s add more clients. We know it’s going to make everything worse - Kate already warned us. But why not? Here’s 100 clients for 1 minute:
$ pgbench .. --client 100 --jobs 100 --time 60
number of failed transactions: 66467 (98.965%)
latency average = 88.614 ms (including failures)
initial connection time = 535.353 ms
tps = 11.677752 (without initial connection time)
Only 1% of transactions are succeeding. So only 1/100 clients are succeeding. It’s almost like this workload can only do 1 transaction per second…
If you’ve read Aurora DSQL Best Practices: Avoid Hot keys, you already know what the problem is: every transaction is updating the same (single) branch. No matter which account we pick, we go adjust the only branch by that same delta.
pgbench has a --scale option. In theory, if we scaled this workload out by
100, then we’d have 100 branches. We’d see a higher success rate with 100
clients. We wouldn’t see 100% success, because there is still a chance of
conflicts if two transactions pick the same branch, teller or account.
$ pgbench .. --initialize --scale 100

duration: 60 s
number of transactions actually processed: 44283
number of failed transactions: 44665 (50.215%)
latency average = 67.088 ms (including failures)
initial connection time = 366.432 ms
tps = 742.085722 (without initial connection time)
This time, latency has gone up a bit. We’re doing 5 reads per transaction, so at 742 tps that means we’re reading at ~3700tps. Each row is about 100 bytes, so we’re doing 361K/sec of reads. No components are actually stressed at at this load; the workload just sucks.
Chapter 8: Let’s make it scale
What does an ideal workload actually look like? How would we fix this schema to scale well on DSQL? As I described in avoiding hot keys, we need to kill the aggregates. The simplest way to do that is to drop the teller and branch updates from the script.
As I mentioned earlier, pgbench runs scripts, and we’ve been running a
builtin. We can make our own:
\set aid random(1, 10000000)
\set bid random(1, 1000)
\set tid random(1, 100)
\set delta random(-5000, 5000)
BEGIN;
UPDATE pgbench_accounts SET abalance = abalance + :delta WHERE aid = :aid;
SELECT abalance FROM pgbench_accounts WHERE aid = :aid;
INSERT INTO pgbench_history (tid, bid, aid, delta, mtime) VALUES (:tid, :bid, :aid, :delta, CURRENT_TIMESTAMP);
END;
Then run it:
$ pgbench .. -c 100 -j 100 --time 60 --file tpcb-no-aggregates.script --verbose-errors
pgbench (18beta1, server 16.9)
pgbench: client 94 got an error in command 8 (SQL) of script 0; ERROR:  change conflicts with another transaction, please retry: (OC000)
pgbench: client 94 ends the failed transaction (try 1/1)
pgbench: client 47 got an error in command 8 (SQL) of script 0; ERROR:  change conflicts with another transaction, please retry: (OC000)
pgbench: client 47 ends the failed transaction (try 1/1)
pgbench: client 23 got an error in command 8 (SQL) of script 0; ERROR:  change conflicts with another transaction, please retry: (OC000)
pgbench: client 23 ends the failed transaction (try 1/1)
pgbench: client 37 got an error in command 8 (SQL) of script 0; ERROR:  change conflicts with another transaction, please retry: (OC000)
pgbench: client 37 ends the failed transaction (try 1/1)
transaction type: tpcb-no-aggregates.script
scaling factor: 1
query mode: simple
number of clients: 100
number of threads: 100
maximum number of tries: 1
duration: 60 s
number of transactions actually processed: 392214
number of failed transactions: 4 (0.001%)
latency average = 15.235 ms (including failures)
initial connection time = 263.912 ms
tps = 6563.771204 (without initial connection time)
Huzzah! DSQL is going brrrrr now. 6563 TPS, and the 4 failures were simply due to the RNG picking the same account id.
Our latency has gone down too. Why’s that? We’re doing 2 fewer reads. Let’s add those back in:
SELECT * FROM pgbench_tellers WHERE tid = :tid;
SELECT * FROM pgbench_branches WHERE bid = :bid;
Running again, we get:
latency average = 18.027 ms (including failures)
tps = 5547.106039 (without initial connection time)
Ever so slightly slower than before, but way more throughput. Remember what I said earlier? You should run benchmarks for a while to let the system warm up? That’s what’s going on here. DSQL is scaling well. I wouldn’t say it’s stressed yet, but it’s definitely started to notice that this workload could use a bit more juice. If we ran it a bit longer, DSQL would probably scale out.
From DSQL’s point of view, this workload has suddenly turned up the heat. Let’s turn it up some more:
$ pgbench .. --client 1000

duration: 60 s
number of transactions actually processed: 682083
number of failed transactions: 68 (0.010%)
latency average = 86.087 ms (including failures)
initial connection time = 1361.015 ms
tps = 11614.965584 (without initial connection time)
11614 TPS, but latency went up from 18 to 86ms. That’s somewhat expected - we’re now reading about 5.6M/sec which is quite a bit more than before. If we run this workload for a bit longer, DSQL will automatically bring latency down by reconfiguring itself to handle the increased load. No downtime, no operator intervention required.
Takeaways
In this article we’ve looked at how the TPC-B workload as implemented by
pgbench behaves on DSQL. We’ve covered compatibility issues in DDL, and
explained why this workload doesn’t scale well on DSQL.
TPC-B isn’t an OLTP benchmark — it says so on the tin. But many people reach for it, because it comes with the Postgres toolkit. TPC-B has been deprecated, and for good reason. We recommend that folks try TPC-C which has more complicated transactions and a better designed schema.
In particular, TPC-B sucks on DSQL because it runs into the hot for write key problem. Every transaction touches the single branch entry. If you’re interested in scaling OLTP workloads, you already know not to do this. Hot keys perform way better on single-node systems that on DSQL, but they’re still fundamentally a performance inhibitor. With DSQL, we’ve focused our initial release on patterns that scale well, so that you don’t run into gotchas down the line.
SQL is both a blessing and a curse; it’s awesome how SQL abstracts away the complexity of how to access data, but it does make it more tricky to identify scaling bottlenecks. I hope that this article has been instructive; a way to put theory into practice.
We’re incredibly lucky to have such an enthusiastic community who take the time
to learn about what we’ve built, and try out our new service. Kate, we’re sorry
that you had to muck about trying to get this workload running. I hope you enjoy
the fork of pgbench I made. I wouldn’t recommend running “tpcb-like”, but
maybe the script support is useful for experimenting with.
Finally, if you’re looking to design an application for DSQL, or move an existing application over to DSQL, I hope this helps you think more practically about schema design and how to run your own experiments.